If you take a look at the product descriptions of any successful e-commerce brand – from the Amazons and Asos’ of the world, to smaller yet flourishing websites, they share many things in common.
This is no coincidence – it’s the result of making decisions to do more of what works and less of what doesn’t. Backed up by solid stats and testing, these brands know what will generate more profits and reduce costly returns.
By doing the same, in your own original way, your brand can succeed and generate substantial sales.
Here we’re going to present you with a powerful yet easy to understand infographic which you can refer to when creating your product descriptions.
First, though, let’s take a look at what doesn’t work:
Copied/ unoriginal content – First and foremost, if you’re an e-commerce brand that stocks products sourced from elsewhere, do not copy and paste the manufacturer’s product descriptions onto your website. The same goes for ‘borrowing’ descriptions from your competitors. Copied content does two things, neither of them good:
1. It ruins your SEO – Google does not index duplicate content, so your products may be as good as invisible.
2. It makes your brand appear boring and unoriginal, so will fail to capture the attention of your customers.
‘Exploring different approaches’ – All of your product descriptions need to follow the same style and format. If your descriptions all have a slightly different feel to them, it will look unprofessional, and the strength of your online brand will be diluted.
Failing to invest time and effort – Your product descriptions are the key to unlocking increased sales. Having a ‘that’ll do’ attitude or just assuming that the products will sell themselves is a recipe for disaster, in the form of lacklustre sales and revenue.
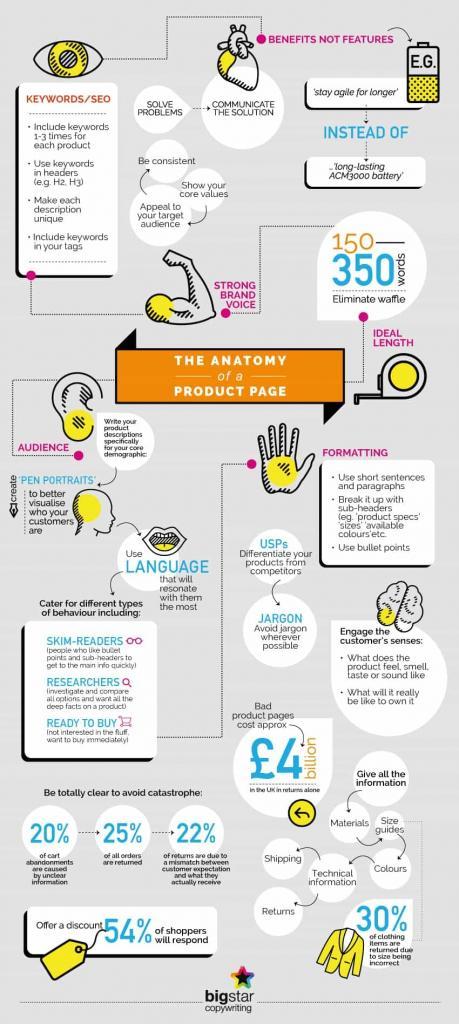
Bear in mind that according to the Nielsen Group 20% of cart abandonments are caused by incomplete or unclear product information.
Adding to that, the Financial Times reported this year that a whopping 25% of all online orders are returned (costing UK companies £20billion each year).
Now contemplate how Trueship reported that 22% of returns are due to product pages not being up to scratch.
That means bad product pages cost UK companies around £4.4billion each year in returns.
Remember that’s just returns AFTER the sale. Imagine what your business could be losing in failed conversions by having product pages that ain’t up to scratch?
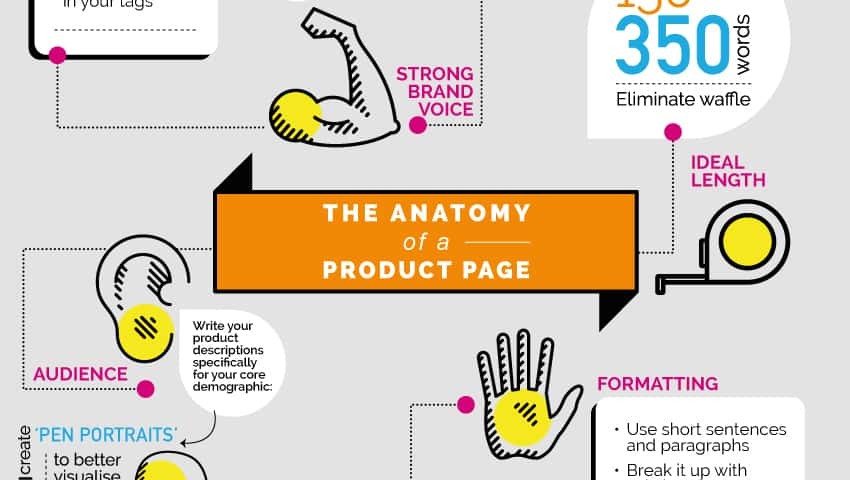
Shock tactics out of the way, here’s the anatomy of an effective product description which you can implement across all your product ranges and make more sales, AND reduce those costly returns.
Infographic: The Anatomy Of A Product Page
Getting more from product pages
If you need additional help with your product descriptions, have a look here and contact us if you need a fast turnaround for your e-commerce site.