Chapters:
- What is content marketing?
- Types of content marketing
- Defining customer personas
- Understanding your audience
- Setting content goals
- Finding new content marketing ideas
- Planning the content marketing lifecycle
- Building your brand
- The content marketing funnel
- Creating compelling content
- Content amplification
- Interpreting content success
- Monetising content
- eBooks
- What to do with old blog posts
- Content marketing examples

What is content marketing, and how does it work?
Content marketing should form an integral part of your brand’s marketing strategy. A report by Semrush, one of the leading content marketing Saas platforms, finds that content marketing can deliver five times more leads and a whopping 55% increase in website traffic. Plus, it costs up to 62% less than traditional marketing.
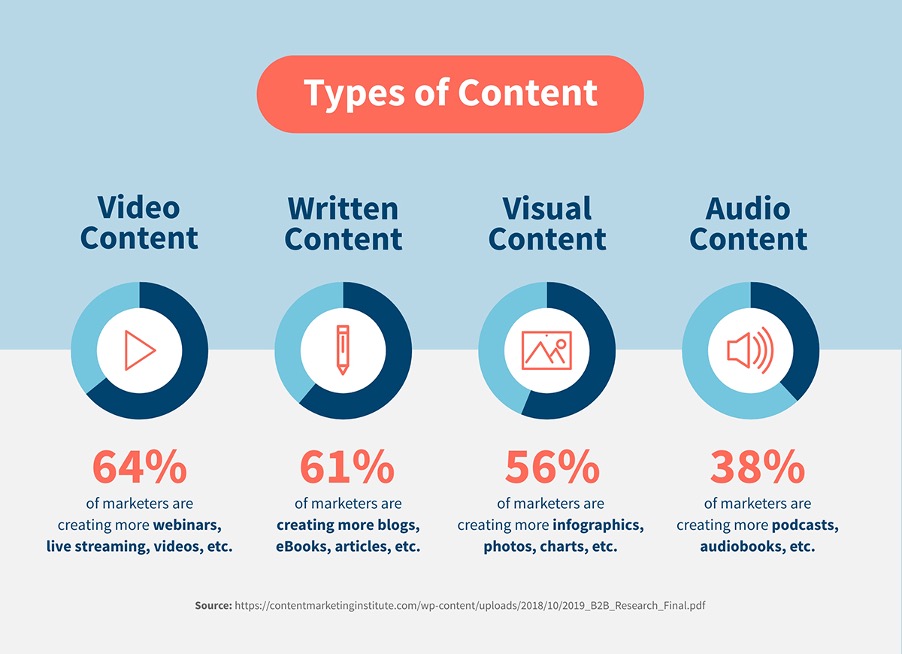
If you’re using social media, blogging, posting videos on YouTube, or even just updating your website with new pages regularly then you’re engaging in content marketing. You can see from the following breakdown that most businesses are already using some type of content in their marketing.
“By adding in strategic elements like content strategy, keyword research, and data analytics you can evolve your current content marketing campaigns into powerful tools for reaching new customers and building your brand online.”
Whether you’re a B2B or B2C brand, this guide will take you through the 5Ws – who, what, when, where and why – plus the all-important how – so you can build an effective content marketing strategy that will lead to better search results, more traffic and ultimately more sales.
What is content marketing?
Content marketing is planning, creating and distributing content that will attract your ideal audience, increase brand awareness, and create sales. The kinds of content you publish and the platforms you use depend on your brand, niche and target customer.
We’re going to look at the types of content marketing and platforms you can use for your business, but first let’s address the importance of content marketing.

Why is content marketing important?
An effective content marketing strategy has the potential to boost conversations. It can also build customer loyalty, increase trust in your products or services and create a strong sense of community around your brand.
Here are a few stats to get you thinking:
- An effective content marketing strategy is 13 times more likely to generate an ROI (return on investment).
- 60% of the most successful B2B marketers document their content marketing strategy.
- 68% of online experiences begin with a search engine – so make sure you optimise content for Google.
- 70% of people get their information from blogs rather than adverts.
- 46% of businesses reported that they wanted to increase their content creation marketing budget in 2022.
Types of content marketing
Choosing the right content marketing mix for your business is crucial. The channels you use and the type of content you create are going to depend heavily on what your audience wants and, to a certain extent, the competitiveness of your niche.
Let’s look at the different types of content marketing that you can use.
Social media marketing
Over 4.6 billion people use social media worldwide – that’s around 60% of the world’s population. It’s no wonder that social media marketing is a staple for businesses across the globe. There are 17 key social media platforms, each with individual features.
Most businesses will concentrate on one or two platforms depending on the nature of your business, your budget and resources, and personal preference.
For B2B companies, your go-to is LinkedIn, but you might want to consider Facebook, YouTube and X, depending on your strategy.
For B2C companies, there’s a broader range to consider – Facebook and Instagram have been stalwarts for some time, while for video content, YouTube is still the king, with TikTok appealing to a younger audience.
Once you know your target audience, it’s easier to create the right kind of social media content, whether it’s a 10-second video on TikTok or a downloadable PDF on LinkedIn.
Blogs
A blog is a powerful marketing tool for your website. It can help increase customer engagement, appear high on search rankings and position you as an industry expert. According to Demand Metric, companies who blog receive an extra 67% more leads a month than companies who don’t.
“Starting a blog is one of the best things you can do for your business – it allows you to harness the power of search engines with targeted posts that answer customer questions in detail and build engagement.”
We think that having a blog is an absolute necessity for B2B clients in particular – it can generate leads directly, almost always results in increased search traffic (when performed correctly) and also nurtures potential customers over time.
Email marketing
Email marketing plays a vital role in modern business strategies. It offers a direct and cost-effective way to connect with customers, nurture relationships, and drive conversions. With personalised messages, targeted campaigns, and automation tools, email marketing enables businesses to reach a wide audience and deliver tailored content.
Unlike social media traffic, which you effectively rent, you own email traffic and can communicate directly – and at low cost – with qualified customers who you know are interested in you and your products and services.
It’s still probably the most effective tool for increasing your customer share. But – combined with effective lead magnets and offers – it can be an incredibly powerful way to engage new customers.

Paid ads
There are some blurred lines as to whether paid ads should be considered content marketing or not. Ads can fast-track your content as part of your inbound content marketing strategy and native advertising e.g. promoted or boosted posts on social media which blends in with the other content in the feed, and paid-for guest blogs and advertorial are all types of content that can be focused on engaging with customers rather than a direct promotion of a product or service.
Then there are more “traditional” forms of paid ads, like banners or Google Ads, which are more explicitly trying to elicit a sale directly. Many businesses now use these types of ads to promote the content they create (reports, eBooks, articles etc) and get it in front of their ideal customers at an earlier stage in the buying cycle.
For the purposes of this guide, we’ll assume that ads are included in our scope, so further on, we’ll look at the benefits of paid ads versus organic content.
Infographics
Infographics are a great piece of branded content marketing because they are easy to digest and highly shareable. By combining the written word with a visual element, you can pack big ideas into small spaces. 84% of marketers who use infographics find them incredibly effective. Could your business benefit from an infographic or two?
For B2B, they can work extremely well – think of creating a graphic step-by-step guide that your customers could have pinned up on their walls, permanently reminding them how great you are. For B2C, there’s also plenty of scope – product comparison charts, how-to guides, timelines, recipes, essential stats and much more.
Video and podcasts
Videos and podcasts are a growing form of content marketing. Although not in our immediate domain here at Big Star (although we do write the words for scripts etc), they can be incredibly effective.
Short-form videos have increased in popularity thanks to the rise of TikTok, and YouTube and Instagram have followed with their own versions. Easy to digest, these quick videos can convey information at speed. According to a 2020 Google study, 70% of viewers bought from a brand after seeing it on YouTube, so it’s no surprise that brands are investing more in this type of content marketing.
Podcasts are also popular. Many brands use podcasts as an extension of their content marketing. However, they take a lot of work and are only sustainable if you have the resources. In 2023, U.S. podcast ad revenue is expected to total $2.28 billion, up 25% year on year. If creating a podcast is beyond your time and resources, it’s worth considering podcast advertising and sponsorship.

Find your audience: define your customer personas
So far, we’ve covered what content marketing is and why it is important. Knowing what content marketing to focus on means understanding your audience.
Defining and getting to know your audience is crucial to content marketing – and probably THE most crucial part of any marketing. It’s often said that good businesses will find a market and then create a product or service for that market rather than creating a product or service and then going to look for a market. The customer comes first.
To get to know your ideal customer, you need to create a buyer persona. The most successful content marketing plans are designed from your customer back to the product. How will you know if your content marketing plan is effective without understanding your customers and what makes them tick?
What is a buyer persona?
A buyer persona is a list of specifications that define and represent your target audience. Although this is not a real customer, but a fictional one that embodies the characteristics of your ideal client, your persona should be as authentic as you can make it:
- Give them a name, an age, a place of residence.
- What do they read?
- Where do they shop?
- What are they like as a person?
- What drives them?
The more real you can make it, the more usable the persona will be. While it’s okay to create more than one buyer persona – you might have products and services that appeal to different types of people – we recommend defining just ONE perfect persona to narrow the focus on your messaging. If you only have one target to aim at, you’re more likely to hit it.
Once you can confidently address your customer, then you can add in another persona. However, creating too many customer personas can confuse your messaging and risk losing sales.

Understanding your audience: what type of content do your prospects want to read?
Once you know who you’re marketing to and where to find them, you need to understand what they want to read. This is the ‘base of the pyramid’ in content marketing.
“By knowing what your customer wants to read, you’ll know what content you need to produce. It starts with understanding your prospects’ needs and then creating content that meets these needs.”
Understand needs first
One place to build a quick understanding of your prospects’ needs is to look at your FAQs (Frequently Asked Questions.) Not just the ones that you post on your website but those you receive regularly from REAL customers – even if they’re objections or unflattering comments.
Once you have these, look at the trending search questions that appear frequently in your niche (you can use Google Trends to take a look at this). These are the questions you get from customers and prospects. They tell you a lot about what your prospects need to hear from you and what underlying needs they are looking to you to fulfil.
Many of these will be matter-of-fact questions, like ‘What are your opening hours?’ If you’re an insurance broker, one of the FAQs you might receive a lot is: ‘How much life insurance do I need?’ People don’t tend to chat about life insurance over dinner, so your prospects will want a balanced answer that doesn’t oversell to them. They want to know how to make a choice that fits both their budget and their need to care for their loved ones if the worst should happen.

Think about search intent
Our approach to content marketing puts a strong emphasis on search. For most of our clients, that generally means Google – it’s got 4.3 billion users worldwide and a market share of over 90%. However, it’s worth remembering that YouTube, Amazon and Facebook are also search engines – and great places to add to your research into what people are looking for online.
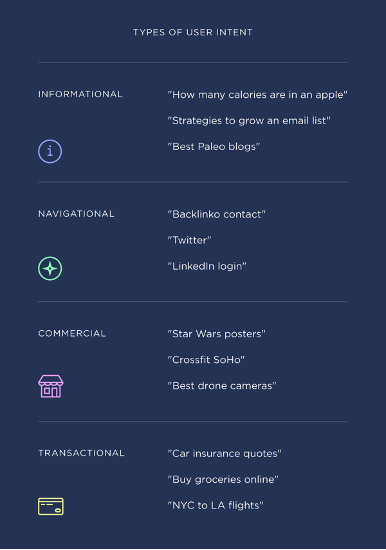
When people head to a search engine, they come with different search intentions. But what do we mean by search intent? Ahrefs defines search intent as the ‘why’ behind a search query – and these can usually be categorised into four different types.
- Informational: the searcher is looking for information – like our life insurance example above. This intent will often cover all those who, what, where, when and how questions.
- Navigational: searchers with navigational intent know exactly where they want to go but ask the search engine to direct them. For example, you might Google Facebook because it’s easier to get the URL than type it.
- Transactional: this searcher is looking to make a purchase – they’re already in buying mode. They know what they want, and now they are looking for the right seller. These searches often look like: ‘buy iPhone 12 case’ or ‘cheap cream carpets’.
- Commercial investigation: this searcher wants a particular service product but has yet to decide. With this search intent, they are most likely looking for blogs or reviews to help weigh up their options. For example: ‘Top places to eat in Exeter’ or ‘iPhone vs Samsung.’
When creating any piece of content, keep in mind the search intent that you are answering. You should also create content that responds to each type of search intent. These are questions you can answer in your blogs, on your social media and by ensuring your SEO is up to scratch on your website. If you’re writing for SEO, take a look at our guide on SEO copywriting.
Focus on delivery
Continuing with our life insurance example, think about how you answer this question in a face-to-face meeting with a client. How would you explain the answer to this life insurance question?
Do you draw a diagram or talk them through the sums to work out an amount based on current income levels? Both? Which method works best?
Now adapt that to your content delivery. If you find that people like diagrams, then create a decision-making flowchart. If they prefer reading, create a blog post titled ‘How to determine how much life insurance you actually need.’
Perhaps they need several types of content working together. Consider creating a ‘Guide to determining the right level of life insurance.’ You could use this as a lead magnet – premium, highly valuable content that’s exchanged for an email address on your mailing list.

In your guide, you can include text explaining all considerations, diagrams to support your points and perhaps a worksheet (or easy online calculator) for the prospect to make their calculations. This helps solidify your authority and moves your prospect closer to that sale.
You helped solve their needs.
When you begin with your prospect’s needs, the content ideas should present themselves. Start with common questions, and take a look at what content your competitors are producing – ask yourself what needs that content fulfils.
“It’s not enough to create content that attracts leads. You need to do something with them once you have their attention. Just like a consumer search with a specific intent in mind, you also need to create your brand’s content strategy with intention.”
Setting content goals
In the last section, we discussed how to understand what type of content your prospects want to read by focusing on their needs and answering their questions. So, now, what do you do with them?
Why does content marketing need a goal?
Have you ever been on a website and read something that made you think: what’s this here for? Or, even worse, you might have found some information on a website that could solve your problem but doesn’t lead you anywhere. You’re then digging around for a contact email or phone number. This is goalless content.
Content without goals is aimless. It could be entertaining, but it’s not going to get you business. You need to be very clear with yourself and your copywriters about your content goals: both your own business goals (are you trying to attract prospects, qualify leads or retain customers?) and the goals of your reader.
Fulfilling both sets of goals is the content sweet spot.

Types of content marketing goals and what to track
Content marketing goals don’t have to be about increasing sales or followers. With each piece of content marketing you create, you’re hoping to filter people through the marketing funnel.
And at each stage of the funnel, the ways you may do that will change. These changes will help you define your specific content marketing goals; the different things that would be helpful to achieve to tick the right boxes. Here are a few types of content marketing goals you might consider and how you’d track them.
More traffic:
More traffic might be your goal if you want to increase brand awareness, build your community or boost your sales. More eyes on your site means more opportunities for users to filter into your marketing funnel. If more traffic is your content marketing goal, creating valuable, SEO optimised content is where you’ll want to start – more on this later on in our guide.
And when keeping track of your site’s traffic, don’t just look at the visitors frequenting your site per week or day. Record where these visitors are coming from, how long they dwell on your site and the pages they clickthrough to. Track this for a while, and you’ll get a good idea of the average user journey most potential customers take when they land on your website.
Better conversions:
Conversions are won when a prospect ticks every box in their decision-making process and is ready to take action. There are many factors involved – trust, social proof, information, ease of the journey etc – and it can take many touch points to achieve a conversion.
From a follow on social media to a newsletter sign-up, conversions can be defined as building a bridge between you and a user. Once converted, it will be easier to contact and up-sell your products or services to them, and thus that’s why conversions are important in content marketing. To track conversions, metrics you might want to focus on include followers on social media, newsletter subscribers, e-book or lead magnet downloads, and engagements on blogs.
Increased sales:
A pretty general content marketing goal – it’s why we’re all in the game. When tracking sales, look for patterns and trends like, how are your buyers finding you? Where are your buyers based geographically? What journey did they take to arrive at your checkout? This type of data will help you make informed and targeted content marketing decisions.
Brand awareness:
The more people who know about your brand, the better. Better brand awareness will hopefully lead to more sales, more followers and more people recommending your products to others. Growth is always positive. Brand awareness can be measured by site traffic, social media followers, video views, social media engagements, blog views or shares – any metric that defines an interaction with your brand. Look for trends in the analytics and use these to inform your content strategy. If users respond really well to one type of content, do more of that in the future.
Better customer retention:
Your customer database is an extremely valuable resource. Just because a customer has made a purchase, it doesn’t mean their user journey stops there. Great content marketing can be used to keep them on your side. From personalised email newsletters to unique offers or deals tailored towards their preferences, your customers, if they loved your product or service, will continue to shop with brands they trust.
You can track customer retention through newsletter engagements, clickthrough rates and sales. You could also consider using personalised refer-a-friend codes or offers to track if customers are willing to recommend your brand to others.
Their goals versus your goals
The goal of content marketing is to become your own media source or your very own publishing house. You want to be seen as THE authoritative source of information for your market niche.
Your business goal is to attract the attention of anyone searching online for the products or services you offer. You want them to see your content, read it and become a paying customer.
But becoming a paying customer isn’t your prospect’s goal.
Prospects realise that they will need to pay you at some point if they choose to do business with you, but that is not their intended goal – it’s an unfortunate side effect of getting their needs met.
Their goals are a lot more practical.

How to uncover user goals
Let’s go back to user needs again because this is where we find out our audience goals.
Our prospect for legal services is looking for a solicitor for a specific reason – to help them buy or sell a home, settle a dispute, or get them compensation for an accident.
Their goal is to find a solicitor to solve their problem. Depending on their socio-economic position in life, they may be looking at keeping costs down, or they may be looking at a price that reflects a premium service.
Spend some time putting yourself in the shoes of your prospects.
- Why are they searching for your service or product?
- How do they feel about those reasons?
- What (information) can you offer that will solve their immediate need?
- Is there anything else they need to know that fulfils their secondary goals (e.g., do you offer a sliding scale fee, or are you ‘down to earth’)?
When planning your content, you’re using the power of empathy to connect on an emotional level with prospects.
How to track analytics and the tools to use
Tools to help you track your content marketing success
Tracking analytics is like having a helpful spy keeping track of potential customers at the various stages of the content marketing funnel. To track analytics wells, you need to choose the right tools and set them up properly. Here are a few we recommend:
- Social media: Most social media platforms have built-in analytic trackers. These will often give you enough data to interpret the success of your content. However, social media scheduling tools such as Later or Hootsuite are great for creating thorough reports that consider your entire social media presence.
- Email marketing: Mailchimp is our go-to. It’s great for tracking sign-ups, unsubscribes and the open or click-through rate of a campaign. We also use tracking to monitor where our sign-ups originate from using Google Analytics.
- Website marketing: Google Analytics, Moz and Semrush are three really great tools to help us monitor the success of a website. They can show you how well you are performing when it comes to SEO and give you great insight to inform any future changes.
Once you have defined your goals, tracking their progress is essential. But having accurate analytics is key. We recommend recording results at the same time each day, week or month, making note of the same analytics. Doing this will provide useful insight into the pros and cons of your content strategy while also providing a consistent dataset to analyse and inform your future marketing activity.
Setting up tracking codes on your website
To track the success of your website SEO and content, you can implement tracking codes to monitor user interactions with your site. Our go-to tool for this is Google Analytics. Google Analytics allows you to measure page views, click-through rates and conversions. You can also add UTM parameters to URLs to track the effectiveness of specific campaigns or channels. Google have published a handy step-by-step guide on setting up analytics for your website here.

Monitoring website analytics
You need to regularly review your website, email or social media analytics to understand how visitors interact with your content, what works well and what isn’t as effective. We looked at the sorts of things you may want to track, dependant on the goals you work towards, in a previous section but as a rule you should pay close attention too:
- Traffic sources: Identify where your audience is coming from, whether it’s organic search, social media, or referral links.
- Page views and time on page: Analyse which pages are most popular and how long visitors stay engaged.
- Conversion rates: Track the conversion of visitors into leads or customers.
- Like, shares and comments: Measure the social impact and resonance of your content.
- Community growth: Track the growth of your audience over time.
- Open rates: Measure how many users open your emails.
- Click-through rates: Track the percentage of users who click on links.
Once you nail finding, tracking and making steps towards your goals, you can use them as a base for your content pillars. Content pillars are a handy tool for planning and scheduling your content strategy. With content pillars, you can confidently create content that covers all bases.
After you’ve established your content pillars, how do you generate or find the content ideas to pack out your content calendar?
“Everyone wants to feel confident in their choices, especially when it comes to how they spend their cash. Successful content marketing addresses these emotions, and this is what leads to those business goals.”
To apply this to our example, we might discover that our prospects’ goals are to:
- Understand how a solicitor fits into the home-buying process (knowledge goal).
- Learn what a solicitor does to earn the fees charged during a home purchase (trust goal).
- Work with someone they deem trustworthy (trust, belonging goal).
- Feel that they are on the same level as the solicitor and won’t be spoken down to – that they will have someone on their side looking out for their best interests (belonging, social goals).
Goals have a purpose AND an emotional context. Everyone wants to feel confident in their choices, especially when it comes to how they spend their cash. Successful content marketing addresses these emotions, and this is what leads to those business goals.
Find new content marketing ideas
Now that you have set content marketing goals and know what you’ll need to produce, you might be wondering where all those amazing content marketing ideas are going to come from.
You likely have more to work with than you think. Let’s begin by looking at our users again and uncovering what they want to know.

Use Frequently Asked Questions (FAQs)
Your list of your customers’ and prospects’ frequently asked questions tells you exactly what’s on the minds of your leads. Answering each question with a piece (or series of) content will fulfil a large part of your initial content marketing goals.
Ignoring the ‘What are your opening hours’-type questions, you can expand your answers to the FAQs.
- Do they want to know how to determine the ‘right’ level of life cover? Write a downloadable e-guide that walks them through the process.
- Has your product or service got many features that you haven’t elaborated upon because the designer told you the web copy should be short? Link to an article on the features and then link to your blog posts about how your engineers thought through the issues as they developed the product feature.
- Do your clients not understand how solicitors bill for their time? Create trust and transparency while setting yourself apart from your competitors. Write an article explaining how you calculate fees and give common examples such as wills, probate, and home purchases to show how you bill for services.
Use the right tools
There are plenty of tools out there that content marketers should be making the most of. Here’s a breakdown of the ones we use frequently to help us find great content marketing ideas.
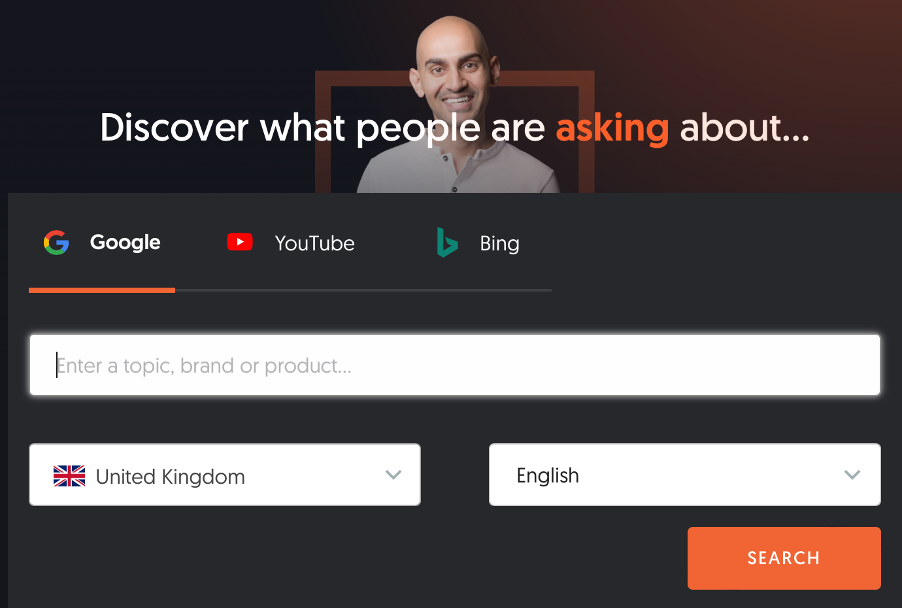
Search engines
By leveraging the vast database of information available, search engines provide real-time insights into trending topics, user queries, and popular discussions. Use search engines, like Google or Bing, to analyse results pages and autocomplete suggestions to uncover gaps in existing content. This will help you tailor your content strategies to address current demands and interests, ensuring that your content remains relevant and resonates with your target audience.

BuzzSumo
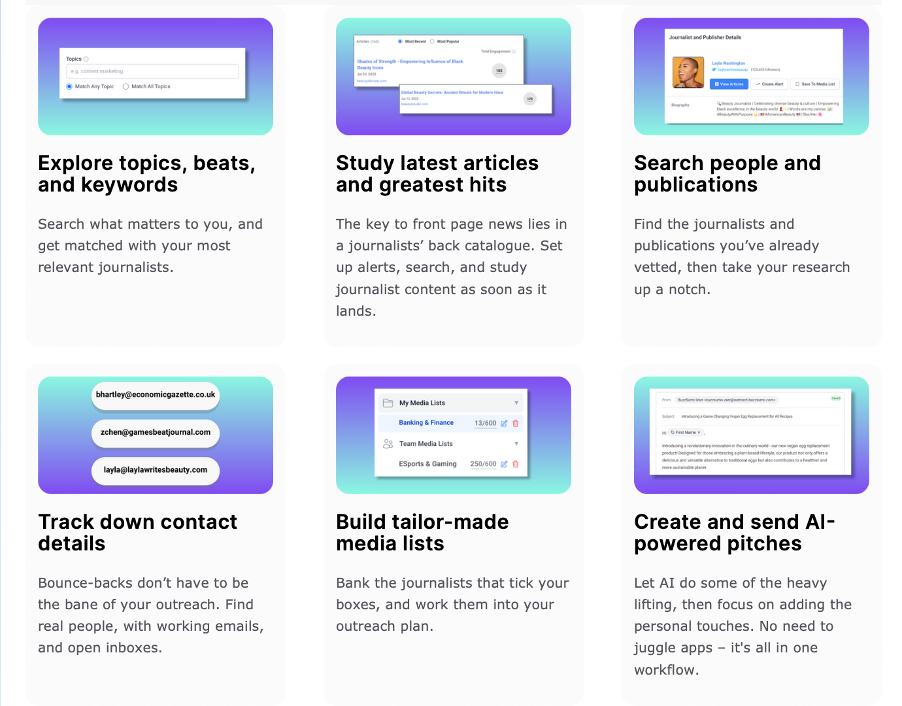
BuzzSumo is a nifty content discovery tool that can be used to identify popular and trending topics. By searching for specific keywords or topics, BuzzSumo provides insights into the most shared content across various platforms, helping marketers gauge the virality and relevance of particular subjects. The platform also enables users to analyse competitor content, identify key influencers, and understand audience engagement. We use this regularly, and it’s a must-have tool to keep in your marketing arsenal.
Google Trends
Google Trends is a fantastic tool for finding content ideas that can help you stay ahead in your content creation game. By exploring the popularity and trajectory of specific search queries, you can identify emerging topics and capitalise on current trends. Google Trends provides real-time data, regional insights, and related queries, allowing you to tailor your content to meet the evolving interests of your target audience.
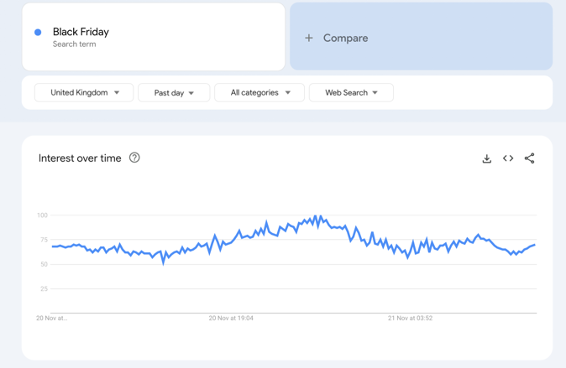
By using Google Trends, you can stay attuned to shifting preferences, optimise your content for timely relevance, and enhance your overall content strategy by aligning with what users like you are actively searching for – without the need for guess work.

SEMrush
A powerful content ally, SEMrush works in similar ways to Google Trends as it identifies high-performing keywords and search queries in your niche. Analysing competitor content strategies, the tool allows you to track the organic search performance of specific keywords, understand the competitive landscape, and refine your content strategy accordingly. With features like backlink analysis and topic research, SEMrush gives you the leverage needed to optimise your content for both search engines and user engagement.
Answer the Public
By using this tool, you can explore the questions and queries users have around a specific topic, helping you tailor your content to address their needs directly. Answer the Public visualises data in a user-friendly way, presenting you with a plethora of potential content ideas based on common search queries. Categorising them by alphabetical order and offering them as a downloadable spreadsheet, it’s like having a direct line to your audience’s curiosity.
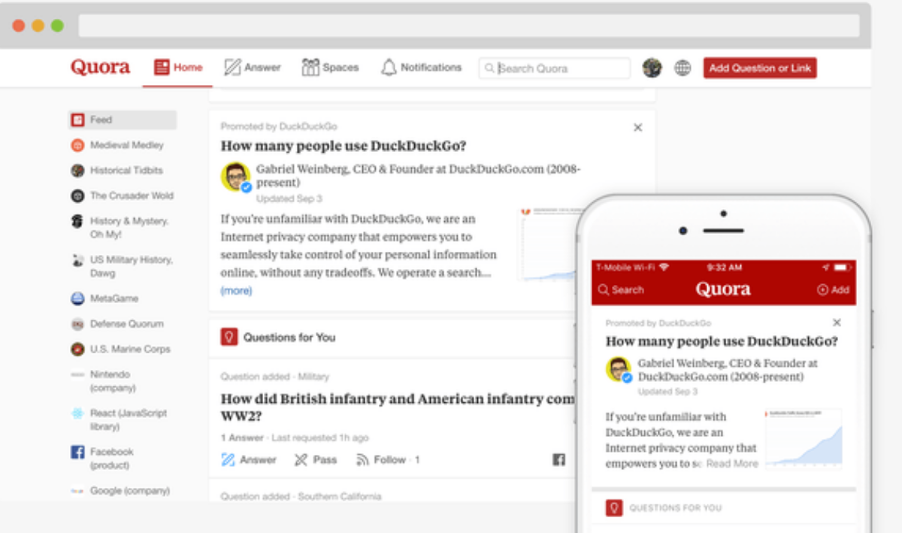
Quora and Reddit
Quora and Reddit are goldmines for content inspiration, providing you with direct insights into the questions and discussions your audience is actively engaged in.
On Quora, users pose queries on a wide array of topics. By exploring relevant threads, you can identify common pain points, concerns, and interests within your niche. This allows you to tailor your content to directly address the questions and needs of your audience, positioning yourself as a valuable resource.
Reddit, on the other hand, with its diverse range of subreddits, offers a vibrant community where users share opinions, ask questions, and discuss various subjects. By participating in relevant subreddits or simply observing discussions, you can gain a deep understanding of your target audience’s preferences and concerns. This insight is invaluable for crafting content that resonates with the specific interests of the community.
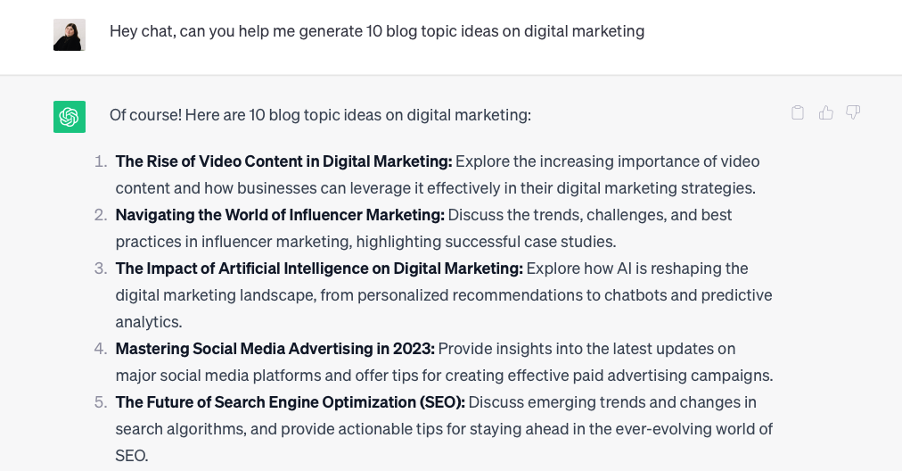
ChatGPT and other LLMs
Exploring platforms like ChatGPT and other Large Language Models (LLMs) can be a unique and dynamic way to generate content ideas. By interacting with ChatGPT, you can engage in conversational exchanges, posing questions or prompts to stimulate creative thinking.
This process often leads to generating fresh perspectives and unique angles for your content. Additionally, LLMs can assist in brainstorming, providing a quick and diverse range of ideas on various topics. You can leverage these models to explore new concepts, refine existing ideas, or even generate a basis for engaging headlines.
Be useful to your target audience
Writing content based on your prospects’ search terms isn’t about targeting certain ‘keywords’ for spammy, useless content.
It’s about using search engine tools to focus on what your prospects are actively searching for so that you can understand their needs.
The difference is that we are focused on what your potential customers want (user needs), not on what search engines want (SEO).

Revisit your print material
If you have already produced brochures, guides and handouts for prospects over the years, then you have a ready source of material to start sharing.
This content is usually well targeted and useful. You probably just need to edit it before sharing it online. Look for the kind of useful, helpful, informative content you’ve previously produced for:
- Trade show flyers
- Front office brochures
- Client guide booklets
- Instruction sheets
- Support documents
The competition
Your prospects will be looking at your competitors as well.
Closely follow the content your competitors are publishing and look for the underlying themes around what they are doing to meet prospects’ needs. Use these themes to help guide your content ideas. You can use tools like SEMrush to help.
You can even respond to, build upon and compliment their work. Look for ways to share and build upon what others are doing in your sector and around the world. This helps position you as a leader in your sector.
We asked Ricky, Big Star’s Search Manager, to share his top tips on how to effectively carry out competitor research and this is what he said:
Step one: Do a Google search for your target keywords and review the top 10 competitors on Google for each keyword. Review competitor:
- Content length
- Keywords the competitor is targeting
- Number of backlinks to competitor page
- Content detail – Can you use and re-word any elements of competitor content?
- The above will help you understand what’s required to outrank your competitor. Your page should be more detailed, better optimised and should have more links than competitors.
Step two: Review competitor websites to understand the following:
- What do they call their products/service pages – are they similar or different to yours?
- What type of content are they posting on their blog and how often do they post?
- What keywords do they use on their key webpages (homepage, service pages)
- Meta data – what keywords are used?
- Content structure – what content is prioritised on competitor navigation menus and the homepage?
Step three: Use Semrush to perform a keyword GAP analysis and identify the following:
- How many keywords do your competitors rank for vs your own website
- What are your competitors highest traffic pages?
- What keywords drive the most traffic for your competitors?
- What keywords do your competitors rank for that you don’t (new keyword opportunities)
- What keywords do your competitors rank well for that you also rank for, but they rank higher than you (optimisation opportunities)
- What international markets competitors perform well in vs your own website perform
Step four: Use Semrush to perform a backlink GAP analysis and identify the following:
- Who has the strongest backlink profile between competitors
- What type of websites link to competitors
- Backlinks that competitors have in common, which are missing from your website (opportunities)
- Opportunities to re-create competitor backlink profiles for your own website
Step five: Use BuzzSumo to identify the top performing articles on competitor websites (based on social shares and backlinks)
Developing a keyword strategy
Content for your website needs to be written with SEO in mind. If it’s not, it will struggle to see the light of day in SERPs. And at the core of great, SEO-optimised copy is thorough keyword research. By understanding how to develop a strong keyword strategy, you’ll find they key that unlocks great content that Google loves and your audience rewards you for. Here’s how to do it:
Step one: define your content marketing goals.
If you’re following this guide, you should have already done this. Your objectives will shape the type of keywords your target. If you want to provide valuable insight to potential customers, informational keywords will help boost brand awareness, while transactional keywords are vital for conversion-focused content. You’ll find at this stage, your keywords will need to align with user search intent, which will vary at each stage of the marketing funnel. That’s why knowing who you are targeting with each piece of content you make is extremely important. This graphic by Backlinko illustrates this well:
Step two: perform competitor analysis
As we detailed above, it’s important to analyse your competitor’s online presence to identify the keywords that are driving their success. Tools like SEMrush, Ahrefs, or Moz can help you uncover the keywords your competitors are ranking for. This insight can inspire content ideas and reveal gaps in your current strategy.
“Your objectives will shape the type of keywords your target. If you want to provide information to potential customers, informational keywords will help boost brand awareness, while transactional keywords are vital for conversion-focused content.”
Step three: leverage long-tail keywords
While short-tail keywords are often highly competitive, long-tail keywords offer a more targeted approach. These phrases, typically three or more words, capture specific user intent. Use tools like Answer the Public or keyword research tools to identify long-tail keywords relevant to your niche.
Step four: choosing keywords with the right volume
Try a free tool like Ahrefs Keyword Generator to discover keyword ideas, and gauge monthly search volumes and keyword difficulty (how competitive the keyword is – usually a score out of 100). Short tail keywords are notoriously hard to rank for if you are not a high authority website. And as we mentioned above, long-tail keywords often better match search intent and tend to have a lower keyword difficulty score. Choose these for better chance at SEO success.
Step five: create your content calendar
Once you’ve identified your target keywords, organise them into a content calendar. This calendar should outline when and how you’ll create content around each keyword. A well-structured content calendar ensures a steady stream of relevant and optimised content, contributing to your overall content marketing strategy. More on this in the next section of this content marketing guide…
Planning the content marketing lifecycle
You should now have enough inspiration to fill a spreadsheet with new content ideas.
Now it’s time to think about how you’re going to write all these ideas up and share them with your growing network of prospects and customers.

What does your audience want?
Before you start bashing out your first blog post, revisit your audience’s needs. Determine how often your audience would like to get information from you. This sets the pace. You can always course correct – social media scheduling tools and email platforms like Omnisend or Mailchimp will often advise when the best time to publish your content is; social media platforms like Instagram or Facebook will give you data based on your posting.
“Test it as you go. If you find it’s not enough to make an impact, turn up the frequency. If it’s too much to do consistently, turn it down.”
Once you have some data coming in you can see when customers interact with you most and tweak how often and when you publish.
Next, determine what you can achieve. Big pieces of content marketing – the juicy items like books or guides to a particular area of expertise – would likely be something you’d publish once or twice a year to make them valuable.
Test it as you go. If you find it’s not enough to make an impact, turn up the frequency. If it’s too much to do consistently, turn it down.
Do what publishers do
Doing content marketing the right way means that you’re creating a steady stream of content that attracts and converts your prospects. In short, you’re becoming your own media source – you are now the publisher.
The web marketing industry could learn a thing or two from the traditional publishing industry, especially when it comes to organisation. Firstly, you’ll need to get your ideas down in a spreadsheet. Then, you need to arrange your ideas into themes.
Arrange the big ideas like eBooks, white papers and downloadable assets over time so that they are spread out.
You should be left with the ideas you’ll want to launch in between your big releases. This is usually articles, blog posts, news items, and other content to share.
Make a content marketing calendar
A content marketing calendar will help you keep to publishing deadlines.
Publishers know what they are publishing months in advance. By committing yourself in this way, you’ll make life easier for you and your content team.
Be practical and consider your audience. If you think your audience would like to hear from you several times per day, you need to plan accordingly.
But how do you make a great content calendar? Here are our go-to tips:
1. Understand your audience and their preferences
You need to tailor your content calendar to your audience’s preferences. Analyse your target demographic, their online behaviour, and the platforms they frequent. Your content should not only align with your business objectives but also resonate with the interests and needs of your audience. This includes the platforms they use, the formats of content they enjoy and the times they are most likely to use it.
2. Align your content with your sales funnel
Structure your content calendar to map onto your sales funnel. Ensure a balanced mix of content that addresses each stage – awareness, consideration, and decision-making. This strategic alignment will nurture leads effectively and guide them through the customer journey.
3. Consistency is key
Establish a consistent posting schedule. Whether it’s daily, weekly, or bi-weekly, maintaining a predictable publishing time builds audience anticipation and helps you stay top-of-mind. Consistency is also crucial for cultivating trust and loyalty
4. Diversify your content types
Spice up your content calendar by incorporating a variety of content types. Mix blog posts, videos, infographics, podcasts, and interactive content to keep your audience engaged. Different content types will resonate with different segments of your audience.
5. Integrate your keywords
Weave your keyword strategy into your content calendar. Assign specific keywords to each piece of content, ensuring a comprehensive coverage of topics relevant to your industry and audience. This approach enhances your search engine visibility and attracts organic traffic.
6. Include seasonal and trend-relevant content
Leverage events, holidays, and industry trends to create content that aligns with the current interests of your audience. This not only boosts engagement but also demonstrates your relevance. Great content in response to high-traffic trends also provides you with the opportunity to get your brand in front of as many eyes as possible.
7. Collaborate across teams
Foster collaboration between your content, marketing, and sales teams. Aligning efforts ensures a cohesive approach to content creation and distribution. We recommend regular meetings and shared calendars to facilitate communication and enhance overall efficiency.
8. Use the right tools
And lastly, you need to use the right tools. They make life ten times easier. You can leverage content scheduling tools like Buffer, Later, Hootsuite, or CoSchedule to streamline the posting process. These tools allow you to plan and schedule content in advance, freeing up time for strategic planning and maintaining a consistent flow of content.
“Tailor your content calendar to your audience’s preferences. Analyse your target demographic, their online behaviour, and the platforms they frequent. Your content should not only align with your business objectives but also resonate with the interests and needs of your audience.”

But don’t let the content calendar rule
Too much organisation can leave you feeling less creative and unable to respond to unexpected events.
Try not to let the calendar dictate how you respond to changes over time. Reschedule, or remove altogether, the ideas that won’t work anymore.
If something comes up that is more pressing (such as huge hikes in insurance premiums due to EU regulations) then change your calendar to accommodate.
A good content strategy allows for content that is proactive (around events, launches, new legislation enacted – where you can plan in advance) and reactive (around news stories, changes in business circumstances).
Plan for recycling
- Take a page from those publishers again. Your content can live on in new releases, versions and updates.
- You can build this right into your content marketing calendar.
- Retweet old blog posts, re-share articles, update guides with new information and add new chapters or analyses to e-books.
- Pulling up older content again makes the context new, and it also accommodates your new customers and prospects who didn’t see that content the first time around.
Remember that all web content should be a living thing – never finished, but always evolving and growing.
Building your brand
Your brand is so much more than your logo. Think of the brands at the top of their game, like Coca-Cola, Nike and Apple – you’re able to easily identify the content they produce. That’s because each of these brands has become synonymous with their style, from the way they write to the visuals they produce and the values they stand for.
It’s all well and good knowing how to make good content and who to make it for, but without consistent branding, you could struggle to keep your audience engaged. David Brier, brand identity expert and author of Brand Intervention, suggests that “if you don’t give the market the story to talk about, they’ll define your brand’s story for you”.
Just as you hope customers come back time and time again to shop for your reliable products, your content marketing should also aim to draw in a crowd and create a community online.
The importance of consistent branding
But why is branding really important? Here are five statistics that say a lot in a little:
- According to the US Chamber of Commerce, 55% of good first impressions are visual.
- Colour increases brand recognition by up to 80%, says Loyola.
- Interbrand tells us that the value of Apple’s name and logo is over $408 billion.
- Pepsi spent $1 million designing its logo, according to Business Insider.
- 60% of consumers have taken an action — either positive or negative — based on a brand’s actions, says Weber Shandwick from KRC Research.
“If you don’t give the market the story to talk about, they’ll define your brand’s story for you”.

Nailing your visual identity
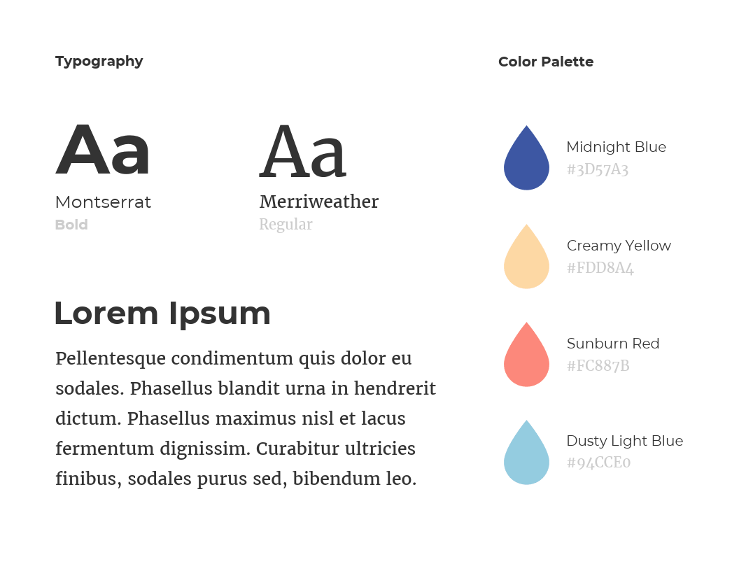
First up on building your brand to-do list is visual identity. As we saw above, your brand’s visuals are incredibly important when it comes to first impressions. Mailchimp says:
“A brand’s visual identity is the impression created by the aesthetic things associated with your business – AKA, its look and feel. That might include your logo, colour palette, imagery, graphics, website design, packaging and typography. The sum of all this should be a unique representation of your brand – one that your customers will instinctively associate with you.”
We recommended working with a designer to create a strong branding document that works well with your brand – unfortunately for us non-designers out there, a Canva logo won’t cut it on this one. Investing in your company’s branding is a must because, at the end of the day, it’s the shop front to your business. And as we know, first impressions really are everything.
Finding your voice
Your brand’s tone of voice is all about being memorable. Going hand in hand with your visual identity, your tone of voice is one of the building blocks that make for a recognisable and highly supported brand. Semrush notes that tone of voice is ‘how a brand communicates and connects with its audience through messaging and customer interactions’. They also add that a well-established tone of voice helps businesses to ‘differentiate themselves from the competition and communicate their brand values to their audience’.
If you think of your favourite brands, you can probably hear the voice of their adverts, social media posts and billboards. When I think about Aldi, Oatly and Mailchimp, I certainly can. These brands have made a name for themselves by saying the things they want to say in a unique way that communicates their values and gets their point across. There’s no faff or uncertainty. It’s just well-written, confident copy. And that’s the sweet spot you need to find when crafting your tone of voice.
Looking for a step-by-step guide to creating your tone of voice guidelines? You’re in luck. We wrote one, and you can read it here. For some great tone-of-voice examples from some of Big Star’s favourite brands, read this blog.

Defining your mission statement
Your brand’s mission statement is a simple piece of copy that sums up the goals, values and objectives of your company. A mission statement is essential for helping your company to respond to change, actions or events and make decisions that align with the overall brand’s vision. You may not have one written down, but you probably know the reason you set up your business. What pain point are you trying to solve? What change do you hope to make? That ‘why’ is your mission statement.
Pinpointing your values
Once you’ve defined your mission statement, you need to pinpoint the values that underpin it. This is the ‘how’ behind your overall objectives. How are you going to achieve your brand’s mission? Perhaps you want to offer a content creation process to take the stress out of idea generation for clients. Maybe you want to provide an affordable solution to the one thing that irks you about being a business owner. Whatever it is that you want to do, your brand values detail the journey you plan on taking to help you get there honestly, authentically and with your audience in mind.
Putting it all into action
With all of the above ready to go, the only thing that’s left for you to do is put it all into action. And when we say action, we really mean consistency. Consistency is the buzzword of the industry because it’s what good content marketing comes down to. Consistently showing up, with a consistent offering and a consistent way of communicating. It really is as simple as that.

Get to know the content marketing funnel
According to Semrush, a content marketing funnel is a model that helps a brand map out how it can use content to attract and retain potential clients. A good content marketing funnel will gently and strategically guide your customers toward your product or services.
The different stages of the marketing funnel
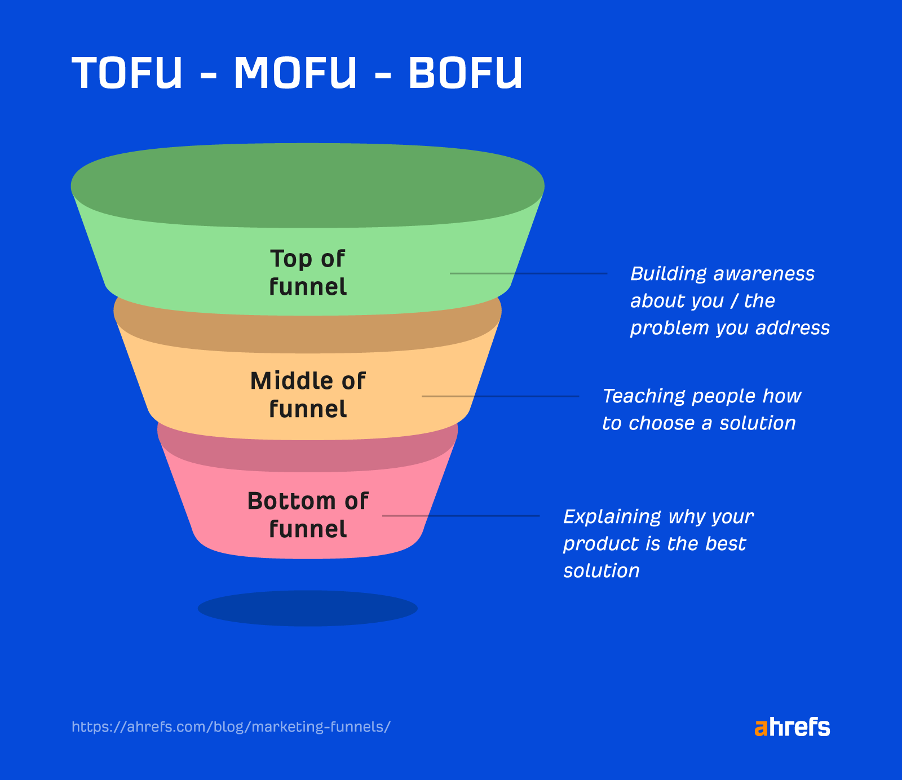
The content marketing funnel has three stages:
- The top of the funnel attracts attention.
- The middle of the funnel generates leads.
- The bottom of the funnel drives conversions.
As marketers, it’s our job to create content to satisfy the goals at each stage.
At the top of the funnel, you’re introducing people to your brand – many of whom won’t have heard of or interacted with your business before – and your goal is to attract their attention, pique their interest, offer answers to their queries and provide information.
At the middle of the funnel, the number of people interacting with your brand starts to reduce slightly. Despite this, those left engaging are doing so more willingly and meaningfully. At this stage, you want to start proposing an in-depth explanation of how your product solves a specific solution. Engage in deeper conversations with these customers with the goal of generating potential leads.
And finally, at the bottom of the funnel, the end is in sight. This is where you’ll either land a bullseye or risk losing customers altogether. At this stage, you want to build trust, show potential customers why they should choose you over competitors, and put in the maximum effort to accelerate the purchase. It’s make or break at this level, but if a potential customer has already made it this far, they’re likely to purchase with the right encouragement.

Creating content for each stage of the buyer’s journey
At the top of the funnel, it’s all about information. Therefore, the content you produce should centre around grabbing the attention of potential consumers with a specific search query to solve or a topic of interest. Focus on long-form content that provides loads of value. How-to blogs, detailed infographics and video tutorials score amongst the best types of content at this stage. Users want to learn, they seek resources, but most importantly, they want to find reliable sources of information that they can turn to time and time again.
“It’s not just the type of content you create that matters. It’s where you publish it, too. Different stages of the marketing funnel will interact with different marketing channels and media.”
Secondly, when we reach the middle of the content marketing funnel, the content we create needs to be detailed and specific in its offering. Product overviews, case studies and webinars that address a specific solution are likely to keep customers on board at this stage.
Lastly, as we reach the bottom of the funnel, these final moments of content creation are probably amongst the most important of your entire content strategy. Customer reviews, testimonials and success stories are the best ways to reach customers who just require that final push. And if you have a good product that does what it says it will, you should have no issue seeing conversions at this stage.
Choosing the right channels for each stage of the content marketing funnel
It’s not just the type of content you create that matters, it’s where you publish it, too. Different stages of the marketing funnel will interact with different marketing channels and media. Here’s what we suggest using at each stage for ultimate success:
- Top of the funnel: Organic search, social media marketing and influencer marketing.
- Middle of the funnel: Email marketing, social media marketing and paid advertising.
- Bottom of the funnel: Email marketing, UGC, organic search and paid advertising.

Measuring the success of content at each stage
How do you know when your content is working? At the different stages of the content marketing funnel, we measure content success differently.
At the top of the funnel, success may look like
- increased traffic,
- high dwell time
- social shares.
In the middle of the funnel, effective content may result in
- newsletter sign-ups
- attendees at a virtual event.
Lastly, at the bottom of the funnel, successful content will result in
- high conversion rates
- good ROI
But the bottom line of the entire content marketing funnel is well-written, engaging content. Content needs to have a purpose, achieve a goal and stay true to your branding. This brings us to our next step: creating compelling content.
Creating compelling content
Creating compelling content is at the core of any successful content marketing strategy. It is the key to capturing your audience’s attention, engaging them, and ultimately converting them into loyal customers. To create great content, you first need to understand your target audience and their needs. As we mentioned earlier in this guide, conducting thorough research to gain insights into their interests, pain points, and preferences is a must. But once you have that in the bag, here are a few tips to help you take your content from zero to hero.
Writing captivating headlines and introductions
Would you read on if you were bored from the get-go? Probably not. And that’s why writing great headlines and enticing hooks is essential in content creation. Here’s how to do it:
- Be concise and specific: Craft headlines that clearly communicate the main point of your content. Keep them short, crisp, and to the point. Introductions should provide a glimpse of what the content has to offer and generate curiosity. But make sure you don’t over-promise, or you run the risk of under-delivering and putting readers off.
- Use power words: Power words evoke strong emotions and create a sense of urgency. Incorporate words like ‘ultimate’, ‘essential’, ‘exclusive’ or ‘proven’ to grab attention and generate interest.
- Incorporate keywords: Include relevant keywords in your headlines and introductions to improve search engine visibility. This helps your content to rank higher and attract organic traffic – as long as the rest of your SEO is up to scratch.
- Spark curiosity: Pose intriguing questions, make bold statements, or tease the content’s main idea to ignite curiosity in your readers. Encourage them to continue reading to find the answers or discover valuable information.

Telling a powerful story
Use this five-step checklist to help you craft a great story:
- Define your story’s structure: Outline the beginning, middle, and end of your story. Introduce the characters, present a conflict or challenge, and provide a resolution or outcome.
- Appeal to emotions: Stories that evoke emotions are more likely to resonate with readers. Incorporate emotional elements such as empathy, humour, or inspiration to create a deeper connection.
- Use vivid language and imagery: Paint a vivid picture with your words, allowing readers to visualise the story in their minds. Use descriptive language, metaphors, and similes to engage their senses and create a more immersive experience.
- Include real-life examples and anecdotes: Incorporate real-life examples or personal anecdotes to make your story relatable and authentic. This helps readers connect with your content on a personal level – people love people.
- Connect the story to your brand: Weave your brand’s values, mission, or unique selling points into the story. This helps reinforce your brand’s identity and creates a stronger association between your content and your business.
How to be persuasive
Persuasive copywriting is the secret sauce that separates the ordinary from the extraordinary. It captures attention, engages your audience and drives action. With persuasive copy, you can conquer hearts, win trust, and have customers eating out of the palm of your hand. But to stand out in a crafted marketplace, you’ve got to get it right. So, here are three tips that will make your copy shine:
- Start with a killer headline: Your headline should make a promise and deliver on it. Let your readers know exactly what you’re going to do and do it with some seriously well-written words.
- Crush objections: Be one step ahead of your audience and address any concerns they might have. Hit them with persuasive counterarguments that ease their curious minds and win them over.
- Test, test, test: Look, nobody gets it right on the first try, and that’s alright. Content marketing is all about being adventurous, trying new things, and embracing trial and error. Keep testing until you find the sweet spot that makes your content shine.
“Persuasive copywriting is the secret sauce that separates the ordinary from the extraordinary. It captures attention, engages your audience and drives action. With persuasive copy, you can conquer hearts, win trust, and have customers eating out of the palm of your hand.”
Why you need to add value to your content
Adding value to your content is like sprinkling magic dust on your marketing efforts. It’s the secret ingredient that has your audience hooked, keeps them coming back for more, and turns them into loyal fans. So, why do you need to add value? Well, it’s simple. By providing valuable information, solving problems, or entertaining your audience, you build trust and credibility.
Without value, you may as well have clicked copy and paste on a boring Wikipedia page. It’s just a huge waste of time. But how do you do it? It’s easy – offer something great. Share practical tips, give insider knowledge, or tell hilarious jokes. Be educational, inspiring, or downright entertaining – or all three. Just make content with your consumer in mind.
Win the race with strong CTAs
Think of a strong call to action as a road sign pointing you in the right direction. Here are five tips to help you create CTAs that pack a punch:
- Be clear and compelling: Make your CTA crystal clear. Use action verbs that create a sense of urgency and excitement. For example, “Grab your free eBook now!” or “Join the exclusive club today!”
- Create a sense of FOMO: Tap into the fear of missing out. Highlight limited-time offers, exclusive deals, or unique opportunities. “Don’t miss out on the sale of a lifetime!” or “Limited spots available – reserve yours now!”
- Use persuasive language: Make your CTA irresistible with persuasive language. Emphasise the benefits and value your audience will gain by taking action. “Unlock the secrets to success” or “Transform your life with our revolutionary product!”
- Keep it simple and actionable: Keep your CTA short, simple, and easy to understand. Use clear instructions that tell your audience exactly what to do. “Click here to get started” or “Subscribe now for instant access!”
- Test and optimise: Experiment with different CTAs and track their performance. A/B test variations to see which ones yield better results. Optimise based on data and feedback to continually improve the effectiveness of your CTAs.
Paid ads Vs organic content
The conversation of paid ads Vs organic content is one that comes up frequently in content marketing. And the truth is, not one is better than the other. Both avenues offer unique advantages and play crucial roles in achieving different marketing objectives. Both should be included in your content strategy, and where and when you use them will depend greatly on the content marketing goals you set at the start of this guide. Here are the differences between paid ads and organic content:
The benefits of paid ads:
1. Purpose:
- Immediate Visibility: Paid ads provide instant visibility, placing your content in front of your target audience swiftly.
- Conversion Focus: Ideal for campaigns with a primary goal of driving immediate conversions or sales.
2. Control:
- Targeted Reach: Paid ads allow precise audience targeting based on demographics, interests, and online behaviour.
- Budget Management: You have control over your budget, enabling you to allocate resources strategically.
3. Speed and Scalability:
- Quick Results: Paid ads can deliver rapid results, making them suitable for time-sensitive promotions or product launches.
- Scalability: Easily scale your campaigns up or down based on performance and objectives.
4. Tracking and Analytics:
- Measurable Results: Detailed analytics provide insights into impressions, clicks, conversions, and other key metrics.
- Adaptability: Real-time data allows for immediate adjustments to optimize campaign performance.
“According to Google, it’s estimated that for every $1 a business spends on an ad, it generates $8 in profits. That means they believe their advertising platform delivers an 8:1 return on investment, which they feel is a conservative estimate.”
The benefits of organic content:
1. Authenticity and Trust:
- Builds Credibility: Organic content, such as blog posts and social media updates, contributes to building trust and credibility over time.
- Long-Term Impact: Establishes a lasting presence that resonates with your audience on a deeper level.
2. Search Engine Optimization (SEO):
- Sustainable Growth: Organic content, when optimised for search engines, contributes to long-term organic traffic growth.
- Cost-Effective: While it requires time and effort, organic content creation is generally more cost-effective than sustained paid advertising.
3. Community Engagement:
- Community Building: Organic content fosters community engagement and interaction, encouraging discussions and brand loyalty.
- Educational Value: Ideal for conveying in-depth information, thought leadership, and educational content.
4. Content Longevity:
- Evergreen Content: Well-crafted organic content, particularly evergreen pieces, continues to attract and engage audiences over an extended period.
When to use each:
1. Paid Ads:
- Product Launches: Utilise paid ads for immediate visibility during product launches or time-sensitive promotions.
- Targeted Campaigns: When precise audience targeting is crucial for your campaign objectives.
- Short-Term Goals: When focused on achieving short-term goals, such as boosting sales within a specific timeframe.
2. Organic Content:
- Brand Building: Prioritise organic content for long-term brand building, credibility, and trust.
- Educational Content: When delivering in-depth information or educational content that requires a more narrative approach.
- Sustainable Growth: For building a sustainable online presence and driving consistent, long-term traffic.

Content amplification
Different platforms have different requirements for publication, and this must be considered when planning and creating content for your brand. And we’re not just talking about the format. Social media will want you to use shorter, snappier sentences that get straight to the point, whereas a blog will require a keyword-studded, in-depth explanation to ensure it ranks well in SERPs.
Optimising your content for each platform
We recommend taking a look at the best practices and algorithm tips for each platform you plan on using before you start writing and designing. Here’s our quick guide to content amplification for the various online platforms used by the majority of users.
How to optimise content on LinkedIn:
- Craft compelling headlines and professional yet engaging copy.
- Include relevant industry hashtags.
- Utilise rich media such as images, infographics, and videos.
- Engage with your audience through comments and discussions.
Tips for publishing content on LinkedIn:
- Use tools like Hootsuite, Buffer or the platform’s in-apps scheduling software to schedule posts in advanced.
- Use LinkedIn Analytics to identify peak posting times for your audience.
How to optimise content on Facebook:
- Use eye-catching visuals and videos.
- Experiment with Facebook Live for real-time engagement.
- Encourage shares and comments with thought-provoking questions.
Tips for publishing content on Facebook:
- Use Facebook’s native scheduling tool or an external platform like Sprout Social to easily batch schedule posts in advance.
- Create a content calendar in Meta’s Business Manager to visually plan your content.
How to optimise content on Instagram:
- Focus on visually appealing content.
- Make use of Instagram Stories and Reels for diverse content.
- Utilise relevant and popular hashtags.
- Use keywords in captions and in social media graphics.
- Tag relevant users.
- Start discussions in comment sections of your own and other user’s content.
Tips for publishing content on Instagram:
- Use apps like Later or Planoly to help plan and schedule posts. Both apps have built-in AI-powered features to inspire content ideas based on analytics.
- Batch-create content in advance to free up your time to create reactive content when needed.
How to optimise content on TikTok:
- Create short, engaging videos.
- Use trending sounds and challenges.
- Leverage duets and stitches for collaboration.
- Film in 1080p as all videos are compressed to this quality.
- Use keywords and relevant hashtags in your captions.
- Be reactive and take part in trends.
Tips for publishing content on TikTok:
- Due to TikTok’s real-time nature, manual posting is often more effective.
- Engage with the TikTok community by participating in challenges and responding to trends.
- TikTok favours authentic content over high-budget, carefully curated videos.
How to optimise content on YouTube:
- Craft compelling video titles and thumbnails.
- Use detailed video descriptions and tags.
- Create playlists to encourage longer viewing sessions.
- This platform favours longer, higher-quality videos.
Tips for publishing content on YouTube:
- Tools like TubeBuddy can assist in optimising video uploads.
- Plan video series in advance to maintain consistency.
How to optimise content on Twitter (X):
- Keep tweets concise and engaging.
- Use trending hashtags.
- Include multimedia for increased visibility.
- Jump on trends and create reactive content.
- Encourage discussions with other figures or brands in your niche.
Tips for publishing content on Twitter (X):
- Use TweetDeck or Buffer for efficient scheduling.
- Reply to and engage with larger profiles in your niche for increased visibility.
To wrap up all of the above, we’ve made two handy content amplification checklists to help you optimise and promote your content on social media. Take a look at them below:
Our social media content amplification checklist:
1. Hashtags:
- Research and include relevant hashtags.
- Tools to use: Hashtagify, RiteTag.
2. Engagement:
- @-mention relevant individuals or brands.
- Respond promptly to comments and messages.
- Use leading questions to encourage discussion.
3. Consistency:
- Stick to a posting schedule.
- Analyse data for optimal posting times.
4. Visual Appeal:
- Use high-quality images and multimedia.
- Experiment with different formats (e.g., carousels, infographics).
5. Analytics:
- Regularly review platform analytics.
- Adjust strategies based on performance metrics.
Our blog content amplification checklist:
- Email Outreach:
- Share new blog posts with your email subscribers.
- Personalize outreach for better engagement.
- Social Sharing:
- Share blog posts across social media platforms.
- Use social scheduling tools for consistent promotion.
- Collaboration:
- Collaborate with influencers or other bloggers for cross-promotion.
- Participate in blogging communities and share your insights.
- Repurposing:
- Repurpose blog content into different formats (e.g., videos, podcasts).
- Share snippets or key points on social media.
- SEO Optimization:
- Optimise blog content for search engines.
- Update and republish evergreen content periodically.
Interpreting content success
We asked ‘What is content marketing?’ at the start of this ultimate guide and by now you should have a pretty good idea. But content marketing doesn’t stop at content creation and this next step is crucial for strategy success. You need to track, analyse and measure analytics to figure out if you’re on the right track and likely to achieve the content marketing goals you set at the beginning. We looked at this in detail at the start of the guide. But now we are left with the question of what do you do with this data?

Reporting and interpreting data is like decoding a secret message that unlocks insights and drives success. Most companies will require weekly, monthly or quarterly reporting. Here are a few best practices we suggest you follow:
- Identify key metrics: Determine which metrics align with your goals and focus on those. Whether it’s website traffic, conversion rates, or social media engagement, choose the metrics that matter most.
- Organise and visualise: Present data in a clear, visual format such as a graph, chart, or dashboard. This makes it easier to spot trends, patterns, and areas for improvement.
- Compare and benchmark: Compare current data with historical performance and industry benchmarks to gain context and identify areas of strength or weakness.
- Identify insights: Look for patterns, correlations or anomalies within the data. Uncover what’s working well and what needs improvement to inform future strategies.
“Analyse the results, looking for statistically significant differences and finally, implement the winning version. But don’t stop there. We suggest that you keep testing new variables to continually refine and optimise your content’s performance. That way, you get more bang for your buck.”
A/B testing and optimising content performance
A/B testing content and optimising its performance are the final brushstrokes on your content masterpiece. First, you need to set your objectives and decide what you want to achieve – maybe it’s skyrocketing click-through rates or grasping hypnotising conversions. Once you’ve done that, you need to choose specific elements to test. Feel free to get adventurous here. Change up things like your imagery, your content heading or your call to action. Next, split your audience into two groups and let the battle begin. Analyse the results, looking for statistically significant differences and finally, implement the winning version. But don’t stop there. We suggest that you keep testing new variables to continually refine and optimise your content’s performance. That way, you get more bang for your buck.
Monetising content
Content marketing aims to build authority in your market niche. Content takes time and many businesses are short on time. However, you can make your marketing investment contribute to the business ‘bottom line’ beyond attracting leads.
Monetise it.
Earning something for your content benefits your business with new customers and creates another revenue stream. This can offset the investment in creating the content in the first place. Here are a few ways you could make your content pay.
1. Turn your expertise into a marketable product
You create your content once and then package it up, turning what you know or sell as a service into a marketable product.
This doesn’t have to be a standalone product. You could turn your service into a scalable online service by offering personal online tutoring, guidance or training via the video calling and social platforms that already exist. For instance, as web copywriters, we use the tools of the web to meet with clients, train new writers and consult with businesses on their content marketing plans. These tools allow us to grow our audience beyond our network and geographic area.
There are many opportunities to turn your knowledge into a monetised product/service.
Products you could create include:
- eBooks (PDFs or Kindle books)
- Training programmes (CD, DVD products or online video training)
- Templates (digital or paper-based)
- Tutorials (via video conference, phone or email)
- Packages of information (paper-based or virtual)
- Detailed plans or guides to a specific niche
2. Share your audience
Publishers have been doing this for over 100 years, so why should we digital-age publishers be any different? We are all media outlets now and can benefit from sharing our audience in the same way magazines and newspapers do.
Sharing your audience doesn’t just mean ‘advertising’. You can earn fees for referrals, endorsing products or services you believe in, and creating relationships with your audience as well as the audience of the item you endorse. In this way, you continue to build your authority while monetising (or offsetting the cost of producing) your content.
- Advertising (banners, Google ads, mobile ads, etc.)
- Affiliate fees (earning for traffic and conversions to another site)
- Commissions
- Recommendations or endorsements
If you do pursue this method, be sure your audience understands why you are doing so, and be clear with them about what constitutes an advert/endorsement and what is opinion. The best practice here is to always indicate when you earn money for telling your audience about another product or service.
“Sharing your audience doesn’t just mean ‘advertising’. You can earn fees for referrals, endorsing products or services you believe in, and creating relationships with your audience as well as the audience of the item you endorse.”

3. Become a content marketing reseller
Another way to become an authority in your niche is to resell products that are of benefit to your prospects and customers.
In a way, this is similar to the point above. Instead of being an affiliate, you gain a product line or service for resale in your own business. This means you are actively involved in the sales process, gaining customers of your own rather than referring them to someone else.
This could work by selling products that complement your service or product offer. For example, if you sell Health and Safety consulting services, you could become a reseller of safety equipment, benefiting your customers by providing a one-stop solution.
Building authority in your market niche with content marketing takes time, but through creative repackaging of your talents, you can make that investment and give something back to your business.
In the next section, we’ll take a look at one piece of content that can attract prospects, build your marketing database and exist as a standalone monetised product: easy eBooks for content marketing.
eBooks
Adding an eBook to your content marketing assets is easier than you might think.
You don’t need to be an author to create an eBook. Instead, you are creating a piece of content that is:
- Useful to your target market.
- Full of information that you already have.
- Valuable to your audience.
- Created once and revisited repeatedly.
Sounds good? Let’s get started.
What’s your eBook about?
Firstly, you need to decide what you’re going to write about.
When we put together our 15-page eBook (get it by subscribing to our newsletter on the right), we knew our readers needed some simple starting points for content marketing copywriting. So it’s important to write your eBook around what your audience needs.

An easy way to make an eBook
If you have a suite of blog posts that are useful to your audience, you can pull them together into a simple and authoritative eBook to cover your topic in depth.
To do this you need to gather the content, order it and edit it into a single volume. The advantage for your audience is that they get everything in one place – no hunting around on your site for the posts.
Even better, you can add exclusive material to your eBook that’s not in your blog posts.
Write an eBook from scratch
If you don’t have a wealth of blog posts or a solid idea to write about, you can always hire a copywriter to create this for you.
If you want to tackle the writing yourself, there’s a great post over on Copyblogger on how to do this: How to Write a High-Quality eBook in 30 Days.
Schedule the time to put it all together and you’re on your way to creating your eBook.
Publishing and distributing your eBook
You don’t need to look to Amazon when publishing an eBook. You can publish it yourself as part of your content marketing funnel.
An eBook is an incentive to sign up for a newsletter. You can also use your eBook as a value-add.
Let’s say you’re a legal firm and you get phone enquiries. Ask reception to request an email address while they book the initial appointment. Then you can send the prospective client an eBook that covers the nature of their query to read before they attend their meeting.
Here you are creating a great customer service experience and anticipating their needs. This creates trust in your relationship.
Hopefully you’re feeling ready to create your eBook. When you do, we’d love to read it.
In our next point, we’ll address what to do with all those old blog posts if you aren’t using them in an eBook.

What to do with old blog posts
In our previous post in the series, we discussed one way you can recycle your blog posts into eBooks for content marketing. And there’s even more you can do with old blogs.
Direct your audience to old posts
We tend to get caught up in our own stories and we forget that there is a regular ‘churn’ of customers and prospects. At any time, part of your audience will be new and won’t have seen your older posts. Make it a part of your content marketing strategy to actively direct your audience to older posts through your newsletter and other marketing channels.
Start here
An easy way to direct your new customers and prospects to your older posts is to create a page for them. You’ll see these on other blogs as ‘Start here’ or ‘New? Learn more’. You can then direct your prospect on a content journey that leads them to your best content.
Create a ‘most popular’ list or post
Many blogs make use of a ‘most popular’ category. This is a list of the top five or top ten blog posts on the website. You can then point new and returning visitors to the most helpful content. You can choose the criteria for which content you list.
“Make it a part of your content marketing strategy to actively direct your audience to older posts through your newsletter and other marketing channels.”
Update the post with new information and send it out again
Revisit your old posts to see if anything has changed since they were published. Can you update the information with recent developments and additional information?
When you update the post, send it out to your audience again, highlighting the changes.
You could also write a new post with updated information that builds on the previous post, with links back to the older post for reference.
By actively directing your audience to older posts and keeping them up to date, you’ll be engaging both new and returning readers/customers/prospects with your content marketing.
Repurposing blogs into other formats
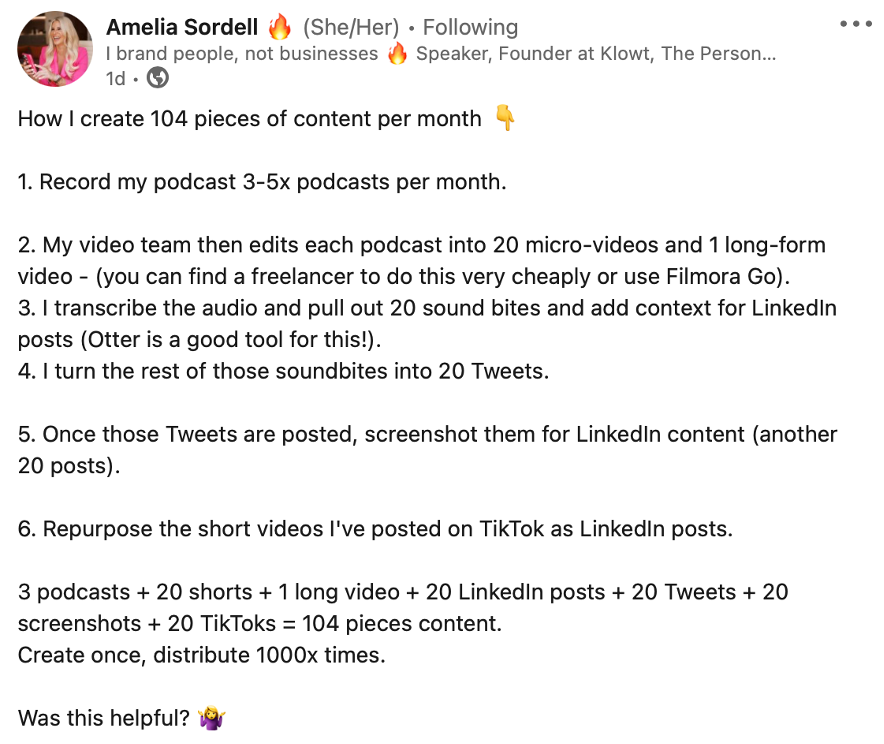
Recycling content doesn’t stop at blogs. With every piece of content you create, there are multiple ways you can reuse it. Turn that long-form video into 10 quick snaps for TikTok. Take that blog post and use each subheading to create a LinkedIn post. And if you’re feeling a little more adventurous, take everything you’ve ever done and publish a whole book on the topic. Content can be reused, recycled and repurposed. It will save you time, money and a whole lot of stress. Trust us. Think of the triple Rs and you’ll be just fine.
Five great content marketing examples
Notion tells an appealing story
Notion speaks directly to its customers with its brand story, which is accessible, relatable and honest. The software platform humanises its brand by using the first-person narrative, and you feel as if you’re conversing with someone who can truly empathise with you as you learn more about the notion story. They know your pain point but they want to help you solve it. Notion knows the benefits of having everything in one place, and with its handy desktop and mobile device app, you can make it happen. You can take a leaf out of Notion’s book when it comes to brand storytelling. It’s enticing, customers feel listened to and you gain a little confidence in the services the task management brand can provide. It’s a great example of content marketing.

Lush bring the good vibes
Lush is known for creating unique product and collection descriptions that ignite a familiar sensory-inducing feeling. They use descriptive language that fits their brand, while taking on a tone that’s casual and conversational. They know their customers inside and out, and this copy proves it. What can you learn from this content marketing example? Your style is important; it should be unique and authentic. Do this, and your audience will be interested.

Apple go big on detail
Apple products are bought and used worldwide. The majority of us know what they do and know how to use them. But that doesn’t stop Apple highlighting their nifty features online. From the UX to the copy, Apple reveal their product stories as you scroll down the page. It’s sleek and a little futuristic – a perfect embodiment of the brand identity. Despite product features that might not make a lot of sense in technical terms, Apple use graphics and descriptive captions to explain how their products work and how you can make the most of them. It’s exciting, immersive and a great example of content promotion.

Mailchimp know why they’re number one
Mailchimp, the email marketing platform, proudly boast that they are best-in-class when it comes to email automation. And they’re not just all talk. They don’t make big claims without backing them up with big results. As you can see from the copywriting example below, the brand shows the effectiveness of using stats to prove a point. They’re confident and they should be. This is a great example of content marketing.
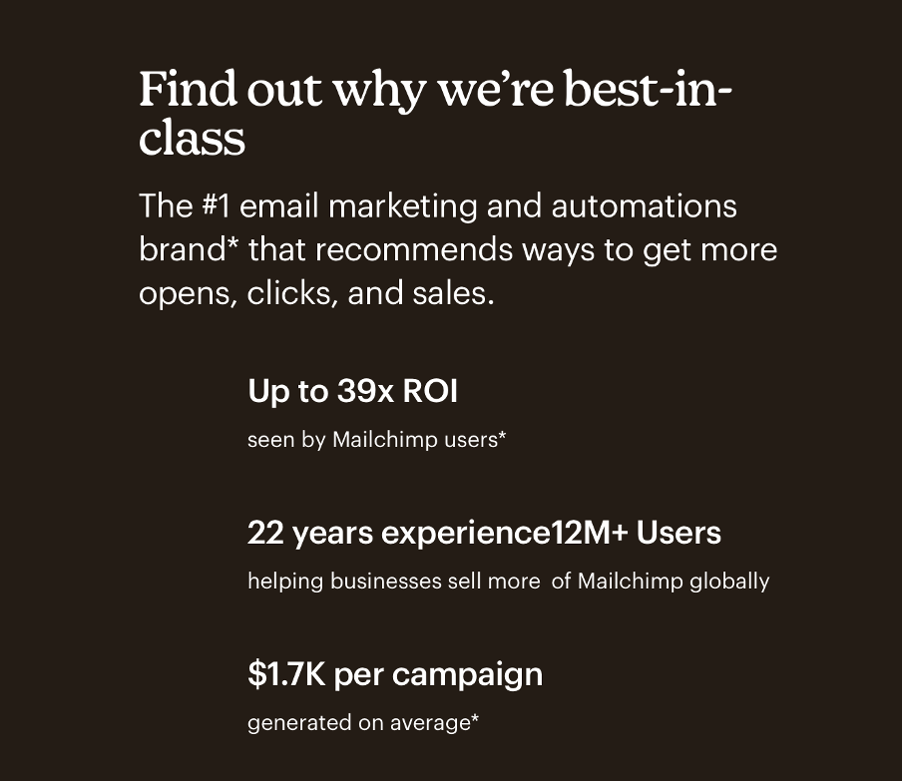
Monzo makes banking simple
Money is why most of us are in the game, and taking care of it should be simple, or so the banking app thinks. Monzo leaves mundane banking jargon behind with its simple, no-fuss copy that makes opening a business bank account sound easy – and that’s because with Monzo it is. It uses concise sentences and avoids any fluff. It’s straight to the point and easy to navigate – perfect for someone just entering the world of self-employment. Monzo show that you don’t need long explanations or boring descriptions that detail the process. Even the most formal of processes can be easy to navigate and quick to handle. This is a great example of content marketing from a brand who know their users and know what makes them stand out from the crowd.

Need a hand with your content marketing?
We wouldn’t blame you – it’s a lot to take in. If you’re a business owner or marketing manager who wants to take your content marketing to the next level, we’ve got your back. Our team has been crafting compelling copy since before the iPhone (yep, we’ve been around for a while!), and we know a thing or two about how to make it resonate with audiences and drive results. Don’t hesitate to get in touch with us to discuss your copywriting needs. We’d love to help!